Thursday, January 29, 2009

Here's a sample of our work from Today...

Posted Yesterday at 10:09am on Subscriber SPX Thread...
"Let me give you an early idea of support, just in case this Miracle fades today... The first area is 852, previous weekly high. The second area will be 844, high of previous volume spike on 30 min basis..."

It waited to fade til today, but take a look at an SPX chart at 12:00 Noon, 852 was tested.
12:06 - "OK, so to reiterate we have 844 support on the cash and 846 on the futures."
12:54 - "TIMING ALERT: The timing of this last low usually results in lower lows after 1:15 E.T."

1:51 - "1:51 BINGO...(previous low tested)"

4:00 - SPX closes at 845, today's low 844.15.

All this and a lot MORE for less than $2 per trading day...

In the Middle of our Winter of Despair

Couldn't help but be disgusted watching the clowns from GE Vision talking just how BAD things are around the World this morning...marching all the corporate and political soldiers in front of the camera to tell their tales of woe and gloom and doom forecasts in the middle of the Swiss Alps...Wait a minute.. these are the guys we love to fade.

All the way down from the top, they beat the BULL drum, telling us it was just "seasonal", and these reports of weakness were just outliers.I could go down a list, but I think starting with Ben BurnYankee proclaiming how small a problem subprime was almost 2 years ago when out of nowhere the market suddenly took a cliff dive at the end of February 2007. and then there was the famous "Chicken Little" comment directed at investors in August of 2007 by this supposed "Economist" Ben Stein in the N.Y. Slimes - the air of denial was thick.

I guess I could go on and on, but the bottom line is these guys have always been a fade. The best thing you can listen to is the market. That's what we try to do here, is get a real read on what the public is DOING, not SAYING.Anyway, the whole thing cracks me up.

Now that it's obvious that the economy is in the tank - the talking heads are now shaking heads.... and if the heads roll down at Hype-Vision, that works for me, especially after watching them grind investor portfolios into dust with all their shameless rationalization...

Back to the charts...

You can follow our General Discussion thread FREE at www.volumedynamics.com

Wednesday, January 21, 2009

From Today's Subscriber Threads on volumedynamics.com

at 2:36 ET the following was posted on our SPX subscriber thread:

***Hourly High broken 3 min Nasdaq and SPX candle trends green. Target for this move will be the bottom of the 10/10 price envelope around 840.

***Timing of high noted as out of countertrend window. Any new high after 2:40 PM ET though confirms the move, increases odds for a close at the highs...

***If you are short here you do not want to see a new high now from 2:40 - 3:15 timeframe.

Friday, January 16, 2009

Volume Dynamics New Website Fully Operational

www.volumedynamics.com

Stop in and register and head to the general discussion forum, it is FREE.

Subscribers get access to our Forecasts and updates for SPX, NAS, ES, Gold, and Oil.

We look forward to seeing you at our new site !

Thursday, January 15, 2009

Rocking and Rolling at Our New Site.

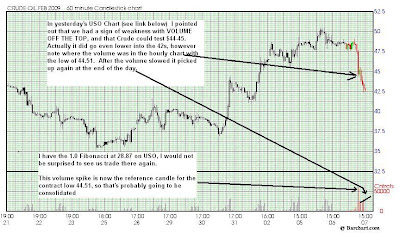
Today we forecast that USO would test 29.15 and 28.87, USO made the low at 28.84 today. Our SPX forecast was that after penetrating the 10/10 price envelope that there would be an attempt at some point to move prices higher. Our support numbers for SPX today were 831 and 815, the low coming in at 818 and then the rally back up to the highs.

Tonights charts for 1/16 trading on SPX, ES, NAS, Gold and Oil are posted.

www.volumedynamics.com

Today's Charts Posted On New Site

And... the links are working.

http://www.volumedynamics.com/

10:45 Updated SPX 30 min annotated chart posted

Wednesday, January 14, 2009

A new website - For Serious Traders Only.

www.volumedynamics.com

It's been a few months in the works, but we're live today. Please visit our new website.

We hope you will join us at the new site!

Sideways Channel Support Breached on Light Volume


So if we have a symmetrical penetration to the downside here that matches the 943 breach to the upside we could see support at 831-2.
There's no volume conviction behind the move today, just another day in a bear market, going down on light volume.
Don't forget Options Expiry, prices can do funny things on funny money by Friday...
11:30 ET Update - 3 min candle trend turns back up... let's see if they are serious.
13:45 ET Update - Both Nasdaq and SPX 3 min candle trends turn back down. Expected retest now on SPX 839.98
15:15 ET Update - So SPX now well under 840, today's trading must be considered in the context of overall light volume on the daily. The key today will be whether or not we close inside or outside the 10/10 trading envelope, regardless of volume.

Tuesday, January 13, 2009

All Time High Volume Day Shapes Market


Proof that we're in a trading type of market, a very bad time to hold short or long. Only traders thrive in this type of environment...

Monday, January 12, 2009

What Happened To The Volume?

(Evidently there is some kind of software glitch, to see full chart click on it)
This is not the level of volume we expect at the turn of the year. In fact we normally get more volume at the turn of the quarter.


So here we are in a sideways move now since October, on declining volume. We're building up to something, but what is it?


Friday, January 9, 2009

Quick Update.

OK, so the jobs report was horrible, but not as bad as ADP made it to be. This morning we should expect a bounce around SPX 885, Nasdaq 1572.

USO/February Contract is on a bullish spring here. Although the volume is pretty high right now in USO and we could see a signal reversal.

Bottom line is Feb crude must climb and maintain 40.57 here to justify a bullish spring long play.

Three minute volume spike low on USO should be tested, we're looking for that to come in on lighter volume for a trigger...

Thursday, January 8, 2009

90 Day Cycle High/Low Due Tomorrow or Monday...

....Who really thinks tomorrow's employment report is going to be worse than the ADP numbers? .......I don't.
....Furthermore, all the ADP #s, Lousy Retail Sales, and all of the other disappointing data had little downside effects...
....Tomorrow could be a rocket ride. For me a 90 day cycle high makes plenty of sense for tomorrow or Monday.

Indices Make New High in Critical Time Window

So we're probably going to see even higher now after 3:15 ET, and there's a good chance of closing on the highs...

4:15 edit - We did close on a new high for the day on Nasdaq and SPX was very close as well, closing just 27 cts below the high of the day...

I hope somebody besides me profited from this information...

Cheers...

Nasdaq Support Structure 1/08


We have "agreement" on support on the hourly and daily charts at 1572.... Downside Volume still unimpressive, let's see if we get this tested today and see a bounce...

If we can break back over 1596 to the previous reference candle range that will become support...

SPX Hourly Update


Unimpressive Downside Volume Overall, be alert for a bounce...

Wednesday, January 7, 2009

USO/Feb Crude Contract Update.


There was decent volume in USO today, I see the next support as 31.96.

Nasdaq Hourly Update


Hourly Nasdaq still doesn't look that bearish, even with all this news. Where are those Bears today? Holding the gap with a wedge is not particularly a sign of weakness either...
A reversal should normally be punctuated by strong quality of downside volume. Now it's possible we're just going to hold for some time in this range. Overall though, when we see compression flat lines after a big gap down openings, that's not verification we like to see of the move...
If we see a new low now by 1:15, that would probably break things loose and a bigger selloff would begin...

Are the Bears Just Sleeping In Today?


....So far volume is a little light for all this price destruction this morning... Certainly the Bears were handed the ball this morning on the news... We will see if news drives it today. We do have a downside target that can be tested. Perhaps we'll see volume pickup to the downside. I'm flat here as posted last evening....
....We expect support to come on Nasdaq at 1596 if we don't bounce before...
More intraday Updates in Comments Section Below, Feel Free to ask me any questions or if you have any comment... let's hear it!

Tuesday, January 6, 2009

The Dirty Double Dojis on the Dailies...


***OK, so above we have 3 charts... the Nasdaq and SPX dailies have the double doji look. A double doji is indicative of buyer/seller pressure equalization. I showed you below the consequences of this indecision in the destabilization of the 3 minute SPX chart in the last hours of the market today. We are setting up a FAST MARKET MOVE.
***You can look on your own charts to see one more important Double Doji... and that is $VIX. When you add to these facts the narrowness of the trading ranges of the past two days, it does say an explosive move is coming...
***My original thoughts were bearish, but the evidence is to the contrary. The Nasdaq is in a confirmed uptrend with a 10/10 price target of 1690. The Daily Candle trend turned back up on progressively higher volume and price. The SPX has also moved higher on improved volume.
***Now the SPX is holding under that price envelope as the Nasdaq is still reaching for the top of it. Markets like to trade in HARMONY, therefore we either reject the top of the envelope on the SPX at 936.36 and the Nasdaq doesn't hit that 1690 target in this timeframe or we'll see a strong rally in technology over the next few days...
***The SPX Hourly chart trend flipped up today, cancelling the 921 test. I'd like to be bearish here, but I don't see it tonight in these charts...
My apologies if you tried to make a comment, I just reconfigured the site so registered users may comment.

BEWARE OF DAILY CANDLESTICKS


We're looking to close on Double Dojis here for the last two candles. Those usually indicate evenly divided buyer/seller pressure. Almost for sure a sign of a trend change or reversal. As I have shown in the daily charts below, the trend is sideways for the last 90 days, so we could be making a dramatic move here...

The3 min chart from today posted above shows some gappy and unstable behavior I pointed out earlier. These are usually early signs of FAST MARKET when we see this in a 3 min timeframe... After the last 2 Narrow Range (NR) days with these dojis, I am expecting a dramatic move dead ahead. I recommend being balanced overnight to flat... Unless you are SURE which way this breaks...

I am not.

A Quick Look at USO/Feb Crude Contract


I have had a lot of inquiries about USO. Since we determined that USO is primarily a Feb. Crude Contract beast, I have an updated hourly chart here with my comments. For USO, all it needs to do today is close over 37.04. Any signals from USO must be considered secondary vs. the February Crude contract however in my opinion...

Intraday Update 3 min SPX


If we don't see volume develop as we go lower, we're going to see a snapback to try and test that high. As you can see the first bounce from the intraday high to the succeeding low this morning was contained within the price envelope of the reference candle (10/10 - 936.36)
If 921 is consolidated on this light volume we could see a strong bounce, otherwise we'll need to see some strong volume on the test to continue lower...

SPX for 1/6/2008


I have 2 charts for you tonight, One is the daily SPX with the trend lines from the Reference Candle of 10/10 (all time volume high on the daily) across the chart straight lines for the high and low. You can see where we traded today. Today we break the 10/10 high of 936.36 on 1/2 the volume for a bearish upthrust. This is the kind of signal we've been waiting for, so we traded short via SDS for a quick profit this afternoon. Now, as you will see on the daily chart we break the high today on improved volume vs. Friday, that leaves room for a retest of today's high.

On the hourly chart I have attached, you will also see that there is a good chance we'll see 921 again soon, probably tomorrow as well. So we'll be looking for one of these two to test and then determine our short or long strategy accordingly...

Welcome To Volume Dynamics

This blog was created in order to better communicate with SERIOUS TRADERS ONLY. We will focus our discussion on the technical aspects of volume and price performance. While fundamentals can enter the picture, we believe prices respond to the technical parameters rather than the latest news. This site is the first step in establishing our services to traders looking for an edge.

None of the information contained in this blog should be regarded as trading advice. We are only responsible for our own trades. This site is intended as entertainment, information and enlightenment. You are responsible for your own trades. Investors and traders should contact a financial advisor prior to risking any funds.

The information presented herewith is related from sources deemed to be reliable, but we make no assurance of reliablity and all facts should be verified.
We are also not responsible for any comments or other information posted by others on the site.

Best of Luck Trading!